
FASTgraphs


About FASTgraphs
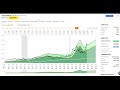
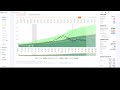
The historical F.A.S.T. Graphs research tool provides a clear historical perspective of the company's normal operating results and prices or valuations. Their primary purpose is to illustrate the strong correlation and functional relationship between earnings and market price (in the long run). These graphs capture volumes of fundamental data at a glance. However, it's important to understand that they are only "tools to think with" and should only represent the starting point to more extensive fundamental research. On the other hand, in an instant, these powerful tools can tell the user more about the success of the businesses behind the companies they are analyzing than any other research tool available.